8 min read
How to Screenshot a Hover State, Dropdown, or Animation
The menu closes the moment you reach for the shortcut. Use DevTools force-state, a timed debugger pause, or capture the CSS itself so the state comes with it.
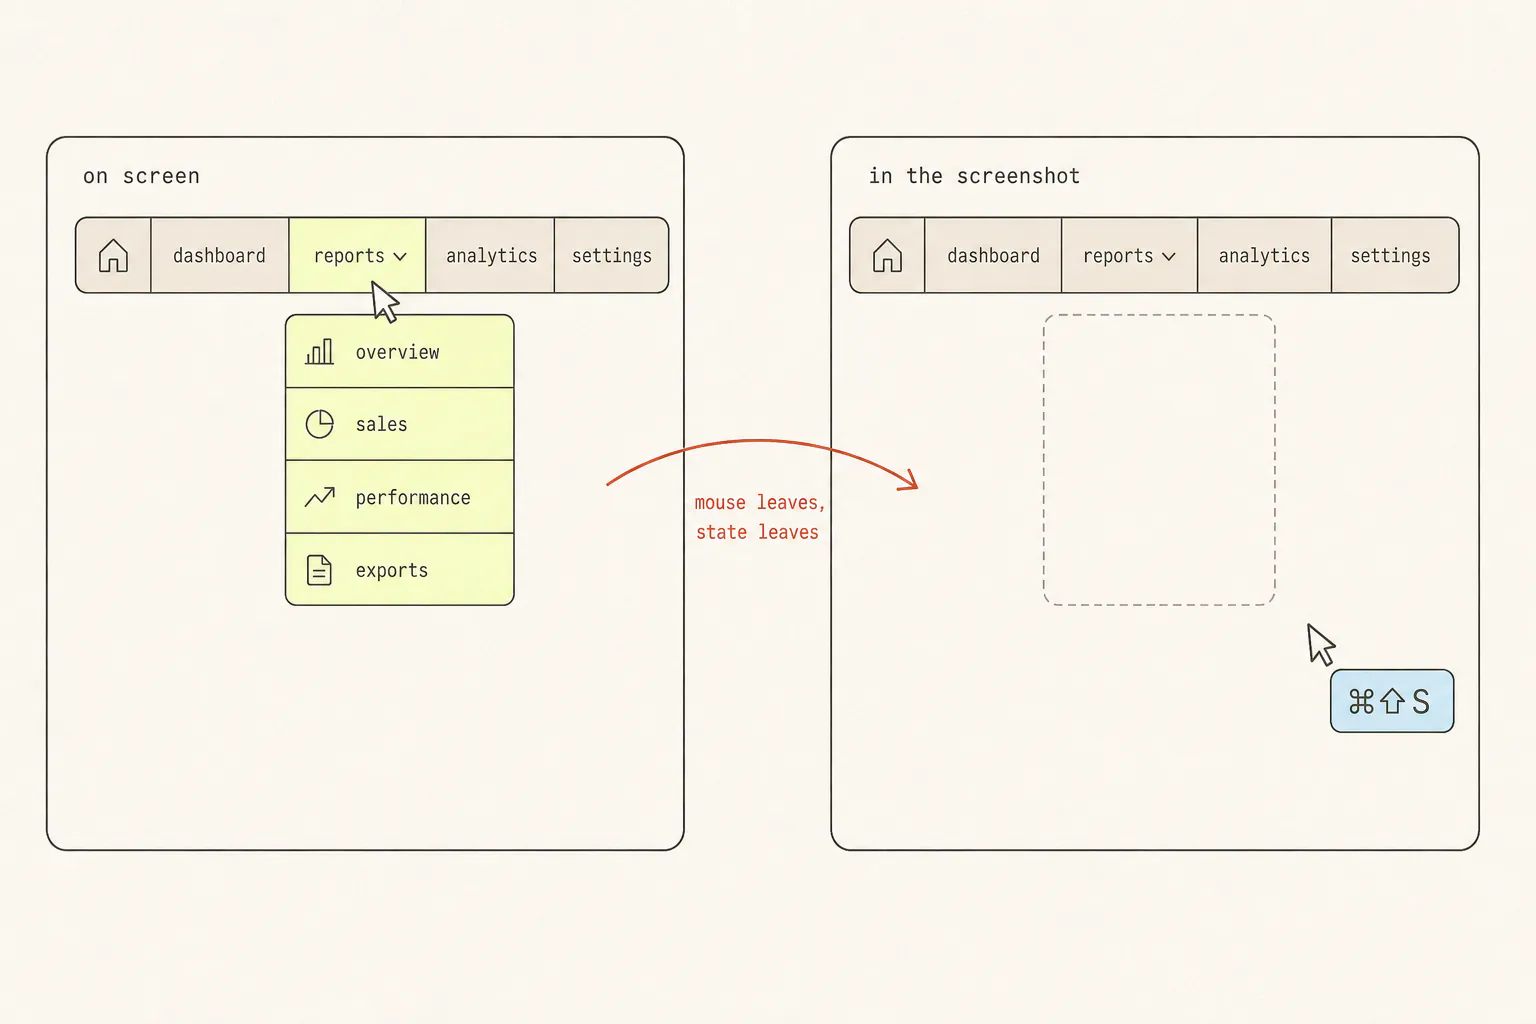
Hover states, dropdowns, tooltips and mid-animation frames share a property that makes them uniquely annoying to capture: the act of taking the screenshot is what destroys them. You move the mouse to reach the shortcut, and the thing you wanted is gone. There are three good answers, and the third one is to stop taking a picture altogether.
Why this is hard
Transient UI depends on continuous input. A :hover rule applies only while the pointer is over the element. A dropdown listens for a click outside itself, or for focus to move, and closes. A tooltip has a dismiss timer. All three are correct behaviours, and all three are hostile to a screenshot, because moving your hand to the keyboard is exactly the event they are watching for.
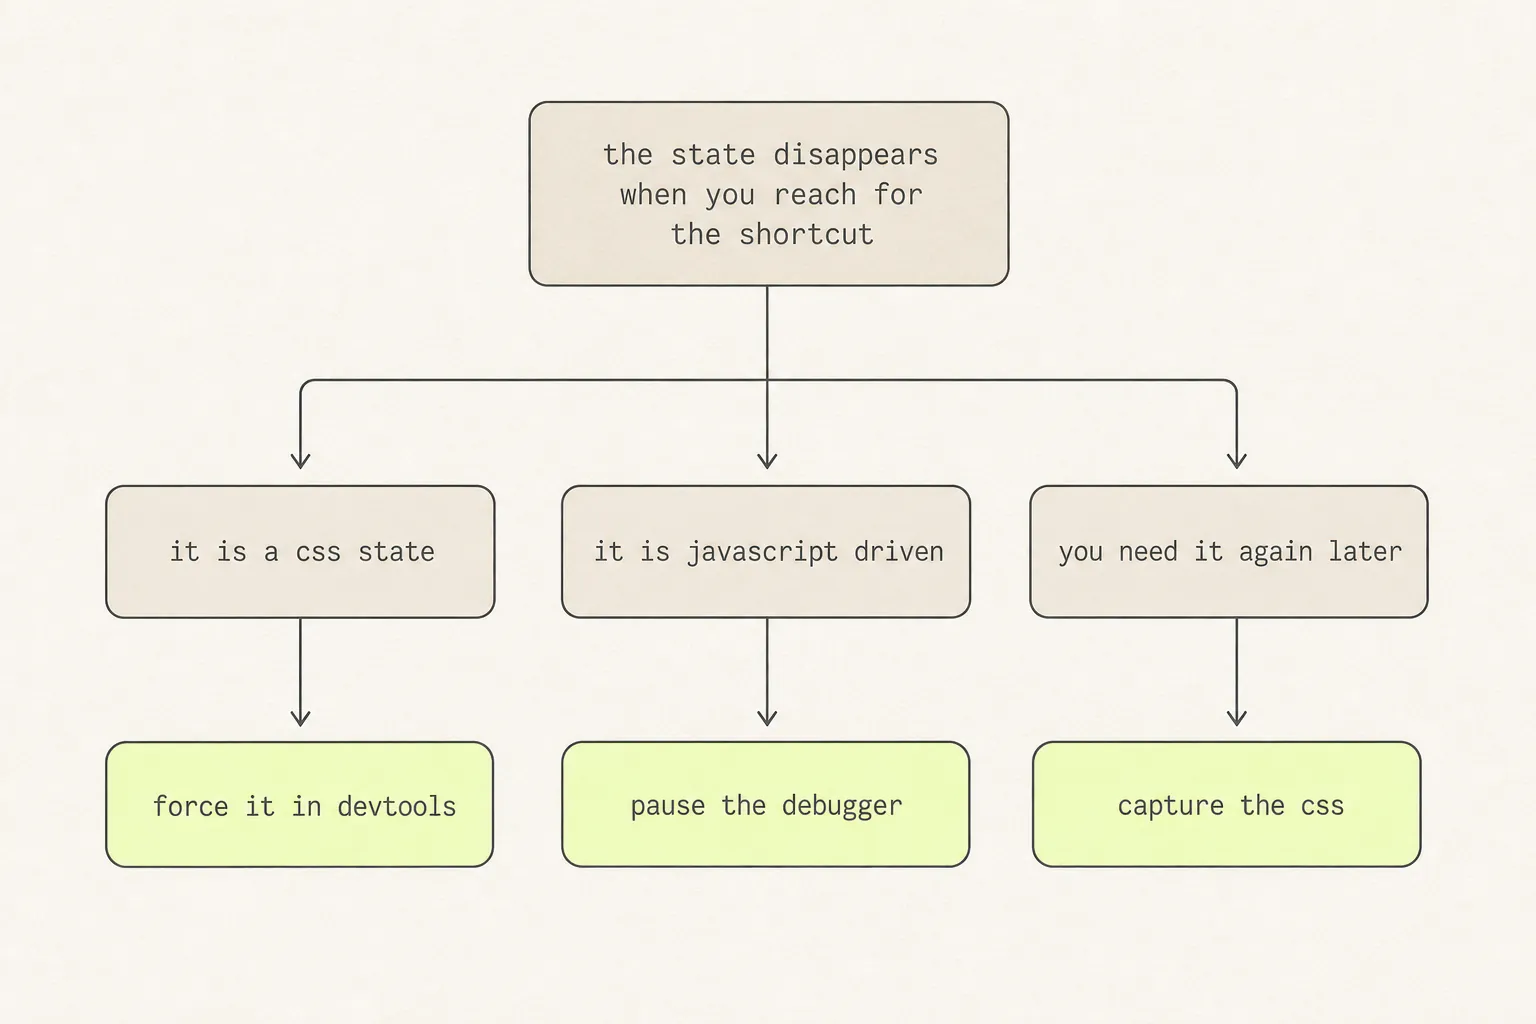
The workarounds fall into two categories: make the state permanent, or make time stop. Which you need depends on whether the state lives in CSS or in JavaScript.
1. Force the state in DevTools
This is the right answer for anything driven by a CSS pseudo-class, which covers most buttons, links, inputs and cards.
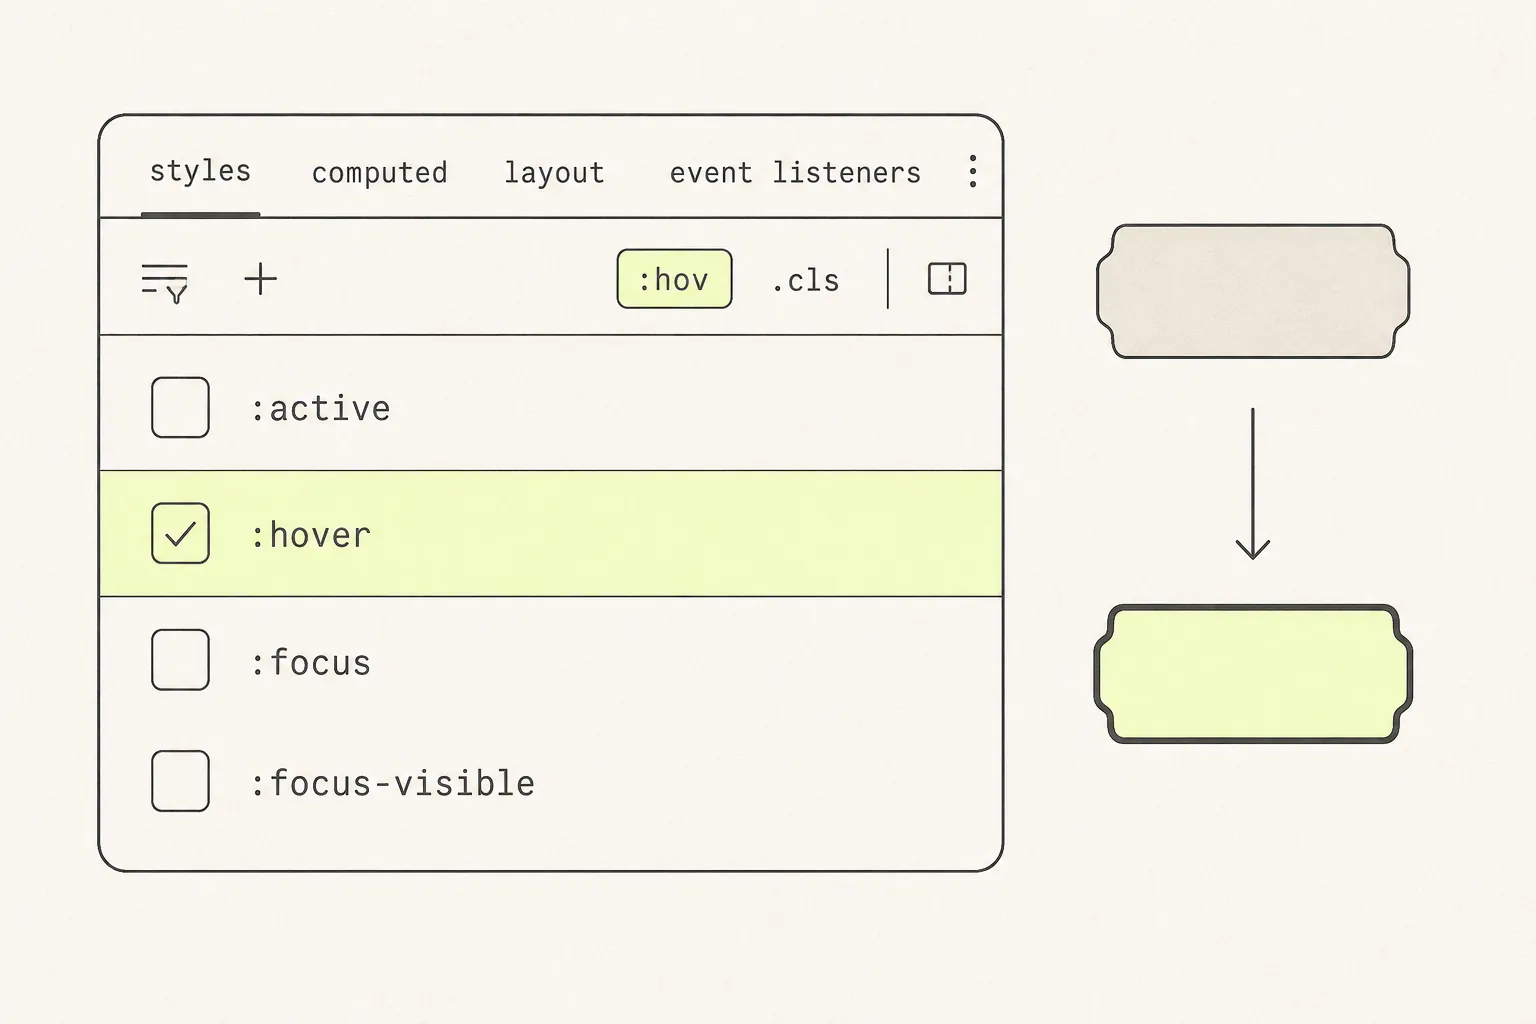
- Open DevTools and select the element in the Elements panel. Right-click it on the page and choose Inspect to get there fastest.
- In the Styles pane, click the
:hovbutton in the toolbar. - Tick
:hover. The element renders as if the pointer were on it, permanently. - Screenshot however you like. The state survives moving the mouse, using the keyboard, and switching windows.
The same panel offers :active, :focus, :focus-visible, :visited and :target. :focus-visible is worth knowing: it is the state that draws the keyboard focus ring, and it is the one you want when documenting accessibility.
Where it does not work
Force-state only affects CSS pseudo-classes. If the dropdown opens because a script added a class or mounted an element, ticking :hover changes nothing — the browser is not the thing deciding. That is the next section.
2. Freeze the page with the debugger
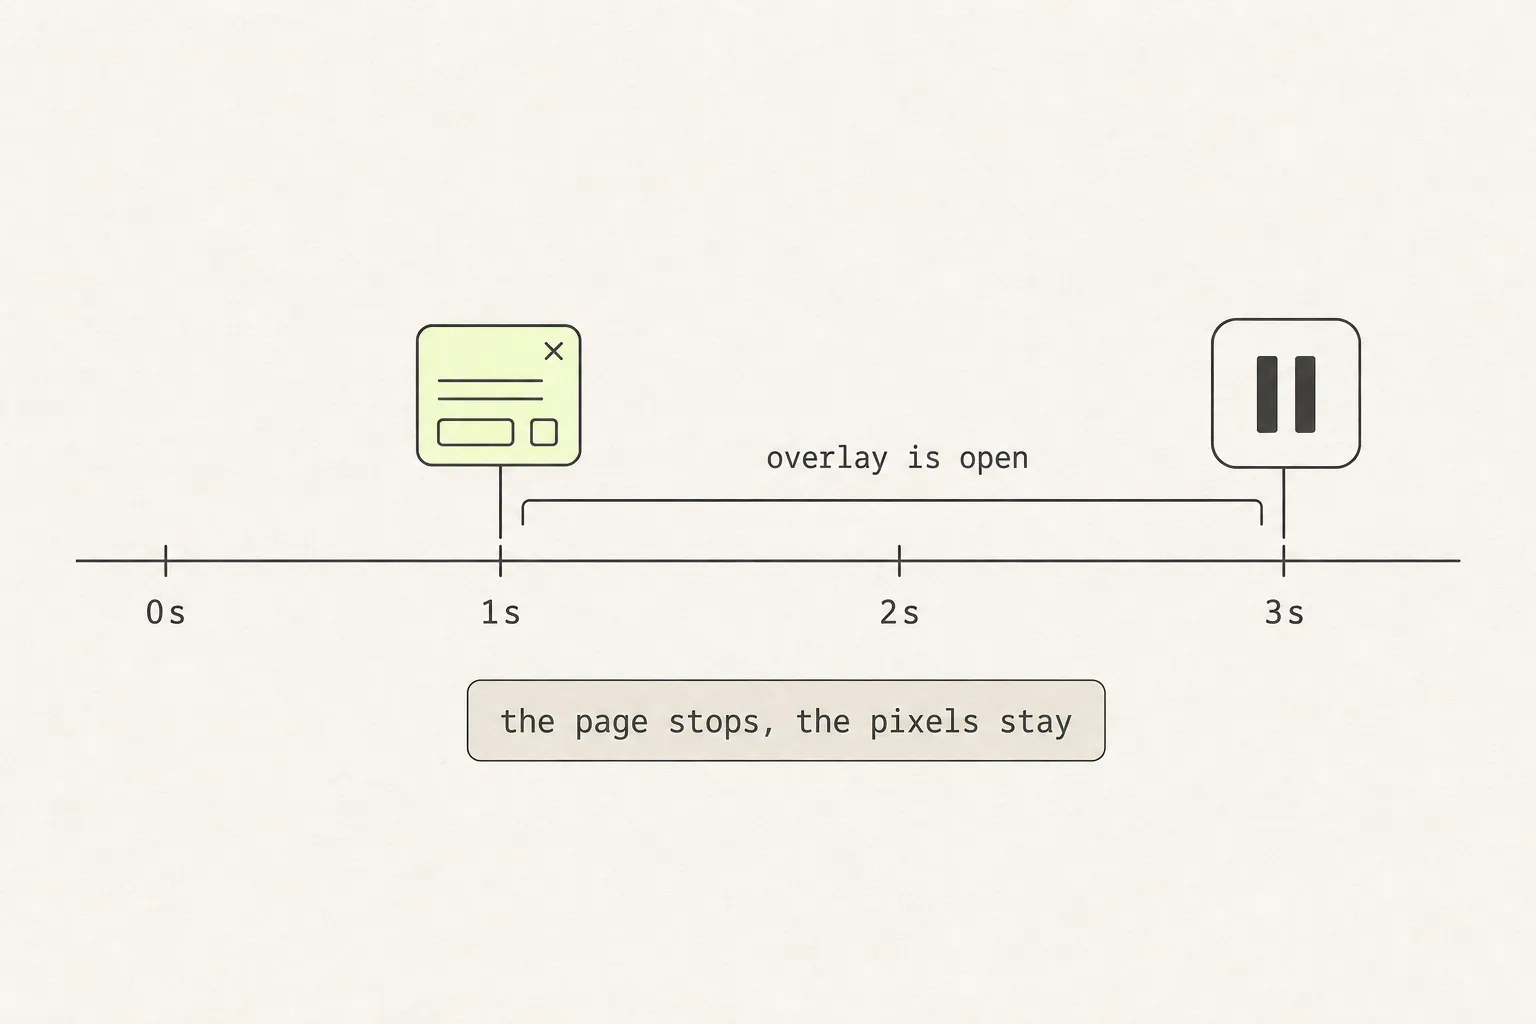
For anything JavaScript controls — dropdowns, autocomplete suggestions, tooltips with timers, modals that close on outside click — the trick is to stop script execution while the overlay is open. A paused page keeps rendering exactly what was on screen and stops responding to the events that would close it.
- Open DevTools and go to the Console.
- Run
setTimeout(() => { debugger; }, 3000). - Switch back to the page and open the menu, hover the element, or trigger the tooltip.
- After three seconds the debugger pauses. The page is frozen with the overlay open and will not respond to anything.
- Screenshot. Then press F8 or the resume button in DevTools to let the page continue.
Chrome also offers an event-listener breakpoint under Sources → Event Listener Breakpoints → Mouse → mouseover, which pauses the first time the pointer enters any element. That is more precise, and considerably more irritating on a busy page.
3. Catching a specific animation frame
Sometimes the problem is not a state but a moment: a transition that flickers at 30%, a loading spinner that looks wrong at one angle.
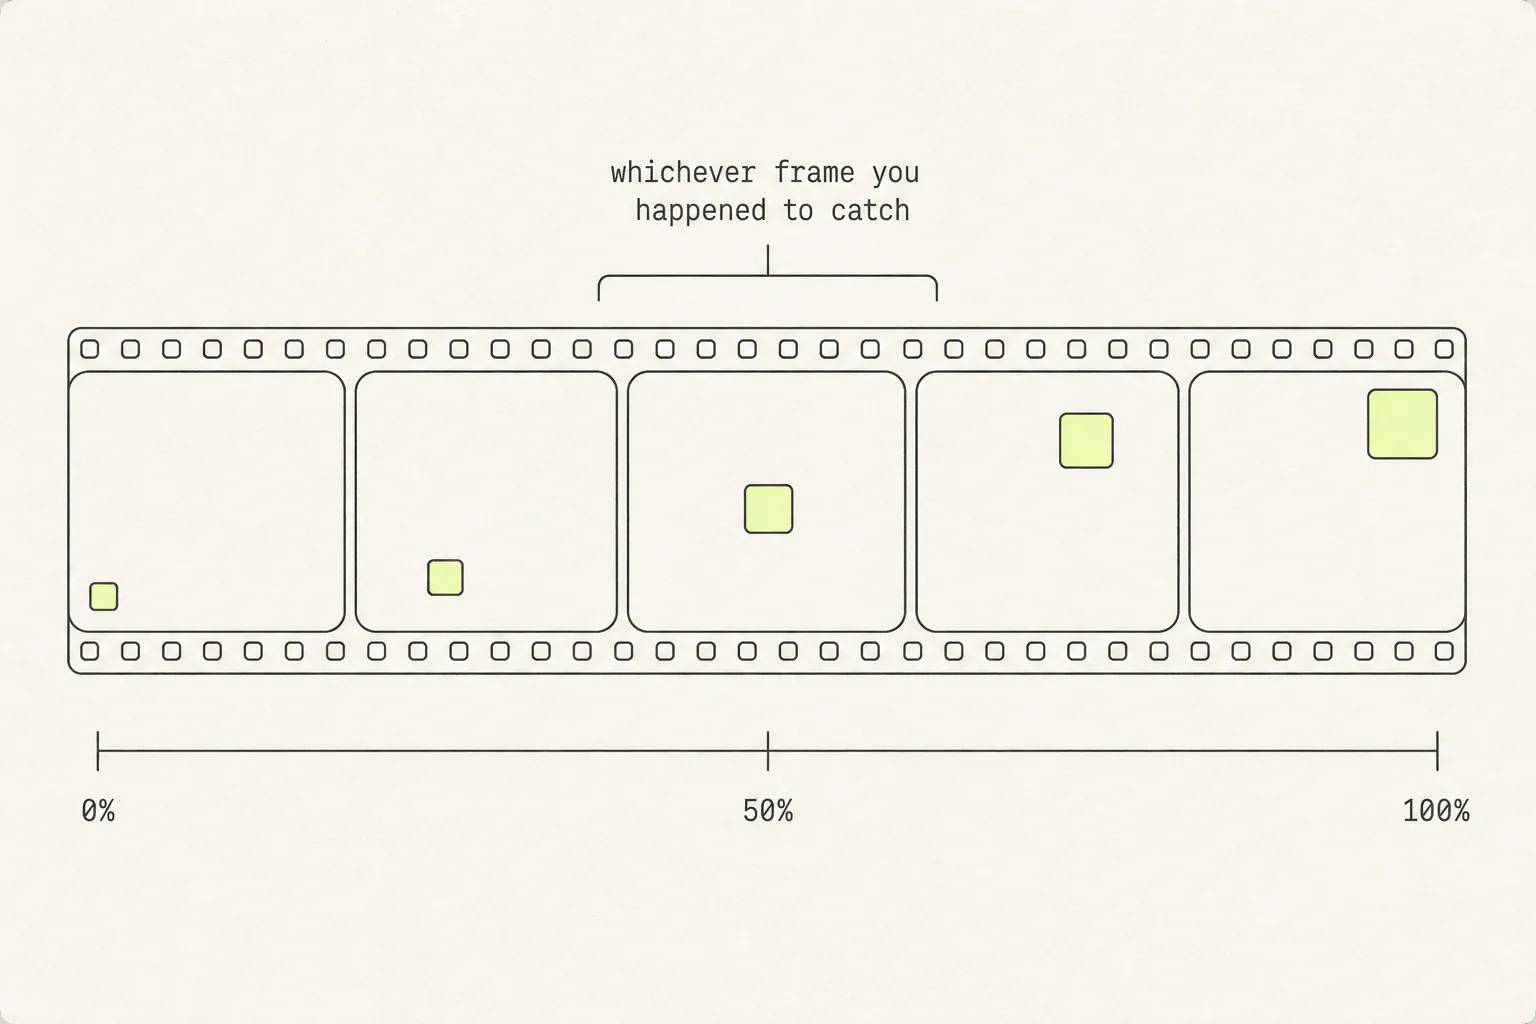
Three tools, in increasing order of precision:
- Slow it down. Chrome DevTools has an Animations panel (in the drawer, via the ⋮ menu → More tools) with playback speed controls. Drop to 10% and the frame you want lasts ten times longer.
- Scrub it. The same panel records animation groups and lets you drag a playhead through them, stopping wherever you like.
- Pin it from the console. For an exact percentage, pause the animation and set its time directly:
const el = document.querySelector('.spinner');
const anim = el.getAnimations()[0];
anim.pause();
anim.currentTime = anim.effect.getTiming().duration * 0.4;
And if you want the animation itself rather than a frame of it, a screenshot is the wrong artefact entirely. Record the screen, or capture the @keyframes rule — which brings us to the last option.
4. Stop screenshotting and capture the CSS
Every technique above produces one frame of one state. If what you actually want is to study how a component behaves, or to rebuild it, a picture is a poor container — you get the resting state and none of the transitions, or one hover frame and no idea what it looked like before.
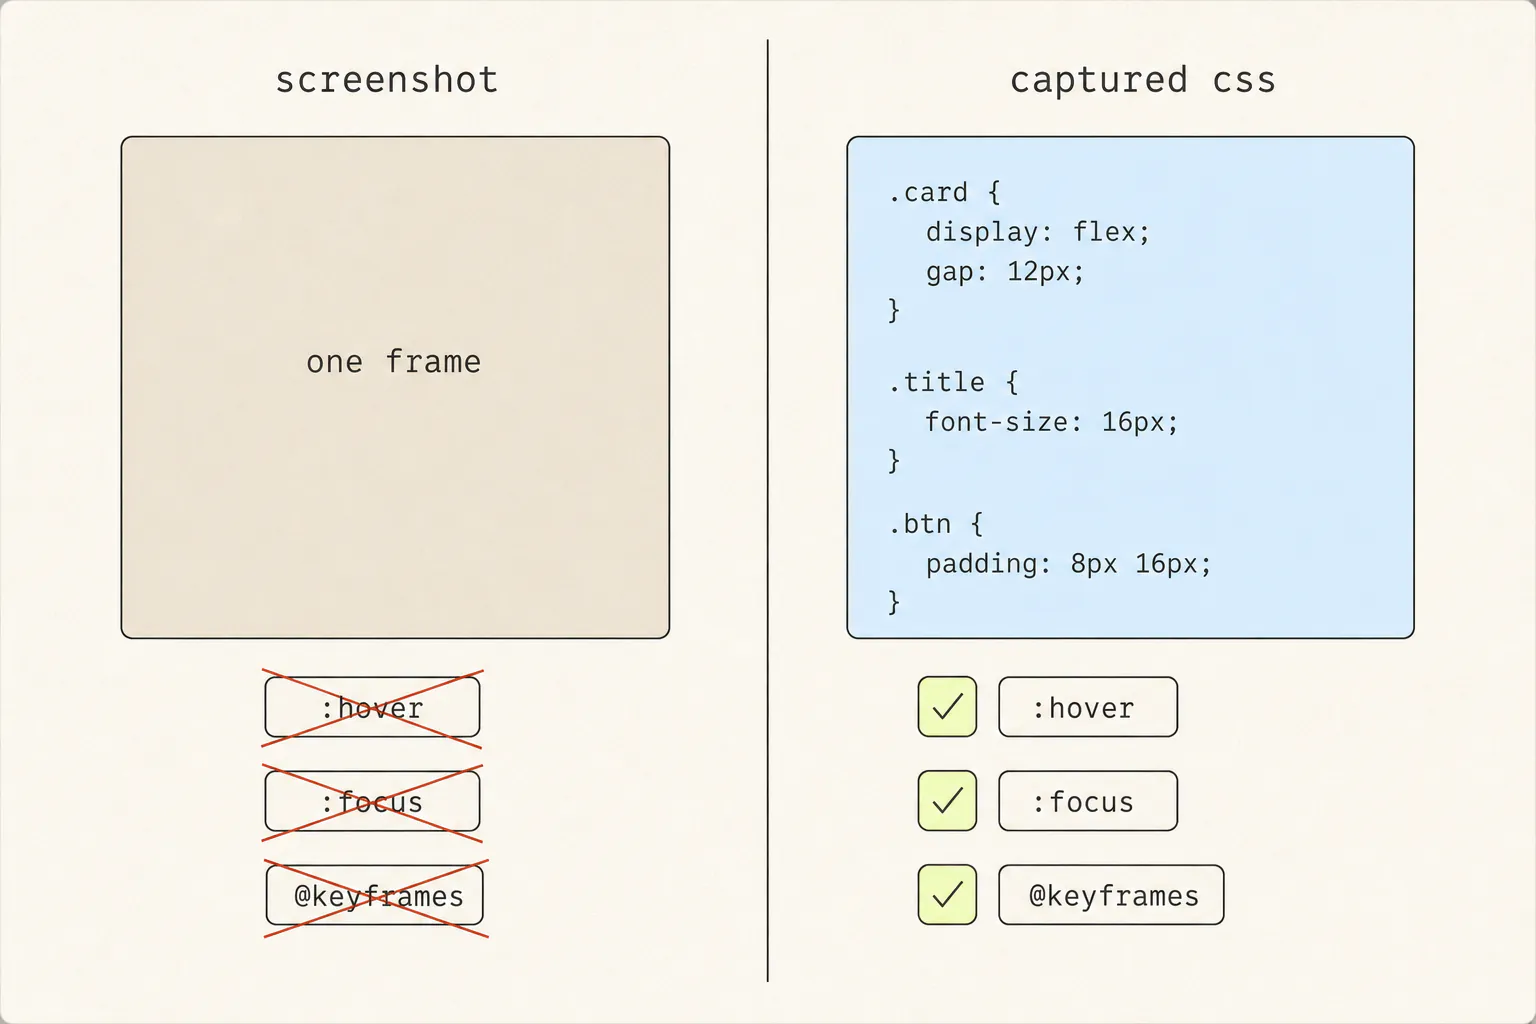
The states live in the stylesheet, not in the element. A :hover rule, a @keyframes block and a transition declaration are all sitting in CSS whether or not anything is hovering — which means a capture that reads the stylesheet gets them all, without you having to trigger anything.
This is what Grabby’s element capture does. Point at a component and it collects the computed styles plus the pseudo-class rules that apply to it, the @keyframes blocks those rules reference, the @font-face declarations the type depends on, and pseudo-elements. The capture opens in an editor where the component is live — you can hover it, resize it between desktop, tablet and mobile widths, and watch the animation run — and export it as standalone HTML or a single-file JSX component.
Copying that by hand from DevTools is harder than it looks, mostly because the styles are rarely on the element you copied. The five things that break when you copy HTML and CSS covers why.
Which one do you need?
| You want | Use |
|---|---|
| A hover, focus or active state on one element | DevTools force-state (:hov) |
| A dropdown, tooltip or autocomplete panel held open | A timed debugger pause |
| A precise frame of a transition or animation | The Animations panel, or set currentTime from the console |
| The keyboard focus ring for an accessibility audit | Force :focus-visible |
| To rebuild the component, or study every state | Capture the CSS, not a picture |
| To show a motion problem to someone | A screen recording — a still cannot carry timing |
The short answer
Nine times out of ten: inspect the element, click :hov, tick :hover, screenshot. It takes about five seconds once you have done it twice, and it works no matter where your mouse ends up.
For anything a script controls, freeze the page with a three-second debugger timeout. And if you are going to need that component again — to rebuild it, or to check what it does at another width — capture its code rather than its pixels. The states are in the stylesheet already.
That choice between pixels and code is the same one behind most capture decisions; the four ways to capture a web page lays out what each format keeps, and interactive state is the row where they differ most.
Frequently asked questions
How do I keep a hover state active while I take a screenshot?
Inspect the element in Chrome DevTools, click the :hov button in the Styles pane, and tick :hover. The element stays in its hover appearance regardless of where the pointer is, so you can take the screenshot any way you like. Untick it when you are done — it persists until you do.
How do I screenshot a dropdown menu that closes when I click away?
Run setTimeout(() => { debugger; }, 3000) in the console, switch to the page, open the menu, and wait. The debugger pauses the page with the menu still open and stops it responding to the click or blur that would close it. Screenshot, then press F8 to resume.
Why does forcing :hover in DevTools do nothing?
Two usual reasons. The state is applied by JavaScript rather than CSS, so no pseudo-class is involved — use the debugger pause instead. Or the hover rule targets an ancestor rather than the element you selected, which is common for cards that reveal a button. Check the selector shown in the Styles pane and force the state on whichever element it names.
Can I capture a hover state in a full-page screenshot?
Yes, if you force it first. A forced state is part of the rendered page, so any capture method sees it — including full-page tools. A debugger pause is different: a paused page cannot scroll or repaint, so scroll-and-stitch capture will not work while it is frozen. Use DevTools’ own capture command for those.
How do I capture a CSS animation rather than a frame of it?
Either record the screen, or capture the element’s CSS — the @keyframes rule and the properties that reference it fully describe the animation, and a captured component replays it. A still frame cannot carry timing or easing, which is usually the thing under discussion.
Does the DevTools “Paused in debugger” banner appear in my screenshot?
It appears in an operating-system screenshot and in a full-page extension capture, because it is drawn over the page. It does not appear in DevTools’ own screenshot commands. If you are using an external tool, crop it out — it sits at the top of the viewport.
Keep reading
10 min read
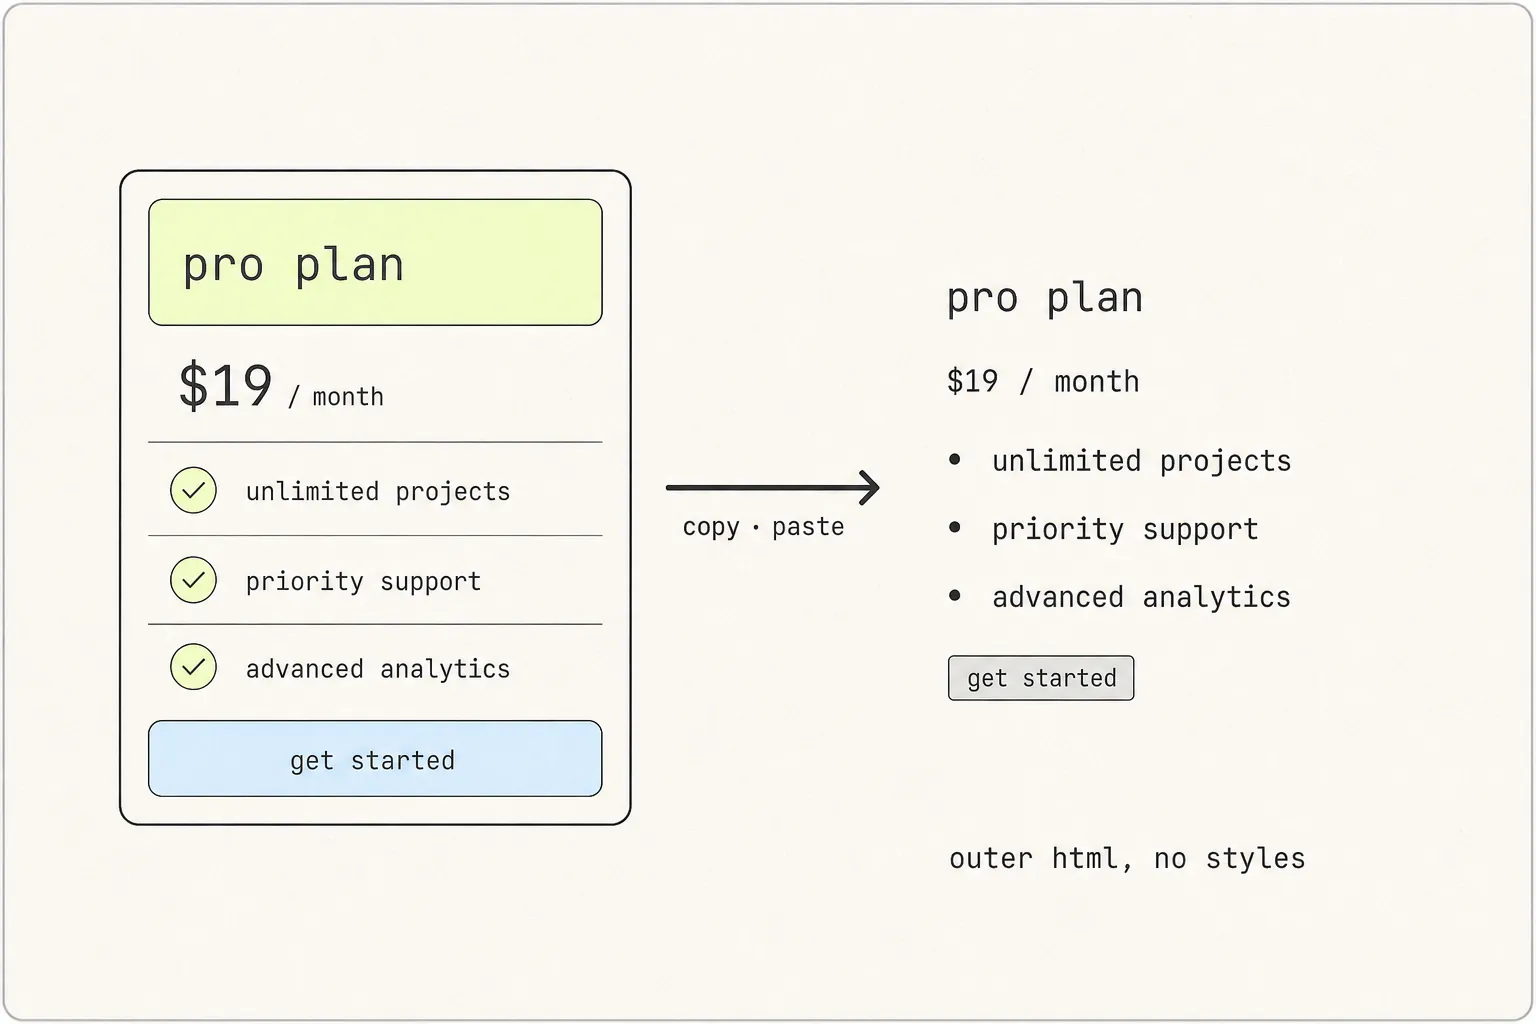
How to Copy the HTML and CSS of Any Element on a Website
The markup is the easy half. The styles are spread across a stylesheet, a :root block, a font declaration and possibly a shadow tree — which is why the paste comes back looking like 1996.
9 min read
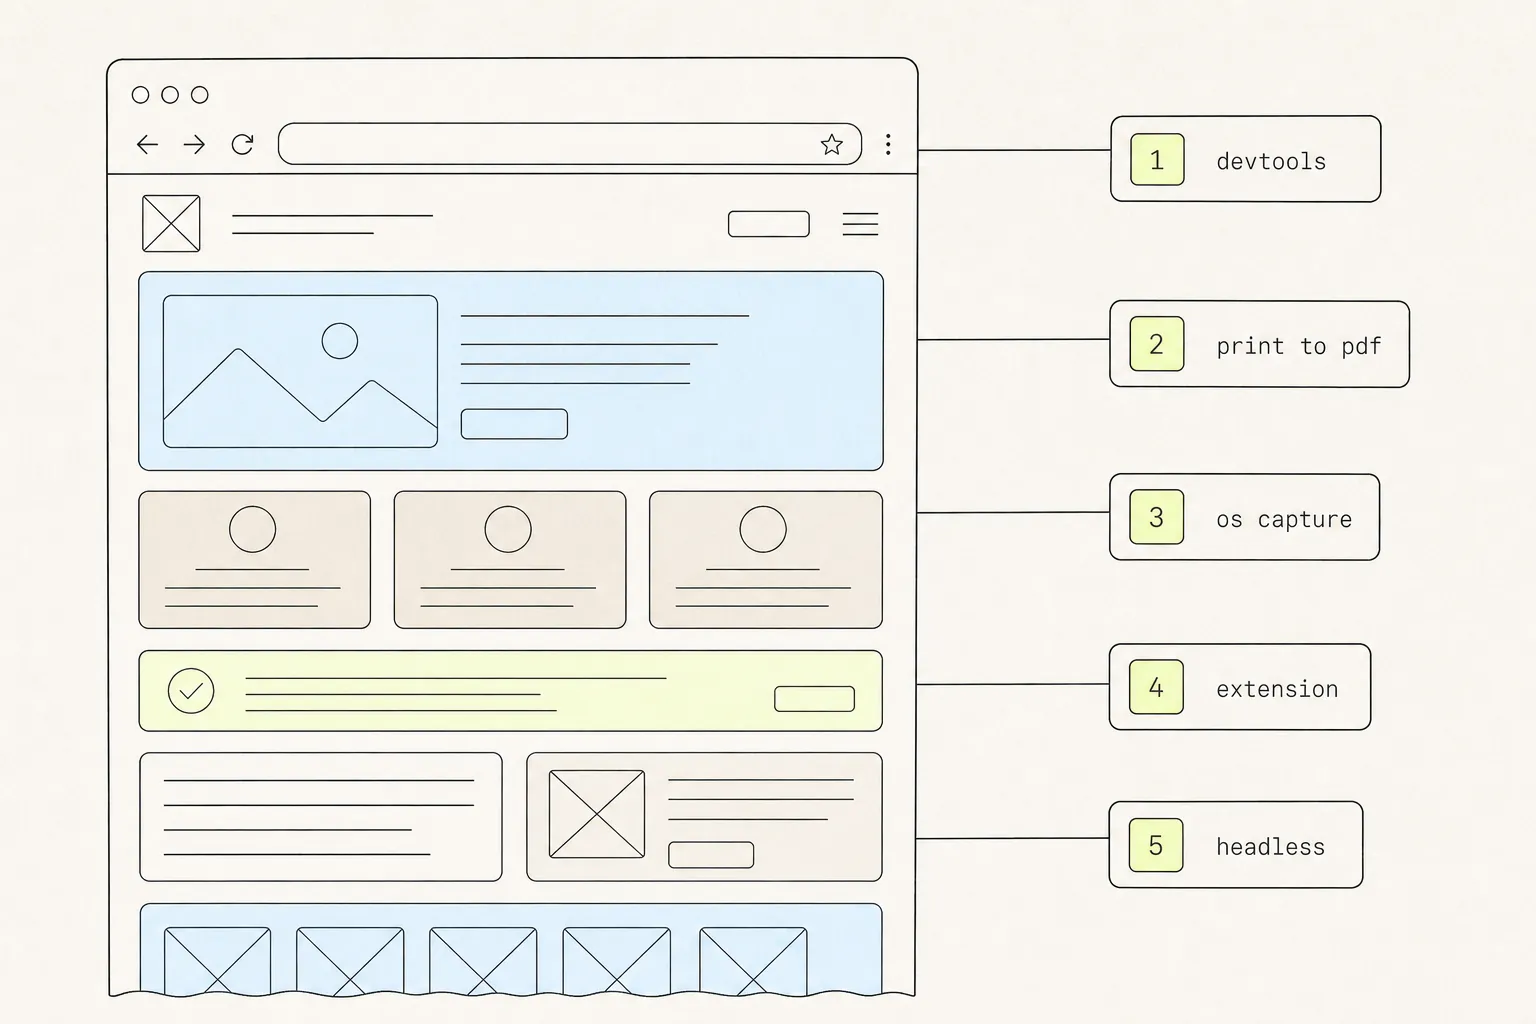
How to Take a Full-Page Screenshot in Chrome: 5 Methods, Tested
Chrome will capture an entire scrolling page without any extension at all. It just hides the command, and gives up on pages past a certain height. Here are five routes and where each one stops working.
9 min read
How to Annotate a Website Screenshot So Feedback Lands
Most screenshot feedback fails not because the arrow was badly drawn, but because the image did not say which thing, in what state, at what width. Here is the craft of it.